

The 60/40 portfolio — 60% stocks, 40% bonds — used to be the default answer to every allocation question. Simple, elegant, Nobel Prize-backed. Stocks generated growth, and bonds provided ballast when markets got rough. Financial advisors loved it. Retirement savers trusted it. The whole thing just worked.
Until 2022 proved it didn't.
That year delivered what Cambria Investment Management's Meb Faber called "likely the worst year ever for a traditional 60/40 portfolio on an after-inflation basis." Both stocks and bonds fell together. The supposed safety net vanished when it mattered most. Investors who thought they were protected discovered both halves of their portfolio could fall at the same time.
Meanwhile, walk into any serious family office today, and the portfolios look nothing like the textbook model. More real estate. More private equity. More direct lending. Barely any bonds. The wealthy figured this out years ago. The rest of the market is catching up.
What's Inside
- Correlation flipped: Stock-bond correlation shifted from -0.37 to +0.60 — the diversification premise behind 40% in bonds broke in 2022
- Family offices rebuilt: US family offices now hold just 9% in fixed income, 27% in private equity, and 54% total in alternatives (UBS 2025 data)
- Yield gap matters: Private credit delivers 10%+ gross returns vs 4-5% Treasuries — after taxes for high earners, that's 6% vs 2.7%
- Tax efficiency compounds: Real estate depreciation, 1031 exchanges, and stepped-up basis at death can eliminate capital gains across generations (US-specific)
- Access has changed: BDCs, interval funds, and non-traded vehicles now let founders access private credit with minimums as low as $2,500-$25,000
- Fees eat returns: Private market fees of 2%+ management plus 20% carry compound relentlessly — a 15% gross return becomes 10% or less after costs
- Concentration kills: Archegos lost $20B in 48 hours through leveraged, concentrated positions — diversification within alternatives matters as much as across them
What Happened in 2022
The theory behind 60/40 rests on one idea: stocks and bonds move in opposite directions. When stocks fall, bonds rise (or at least hold steady). Harry Markowitz won a Nobel Prize for proving this worked, back in the 1950s. For decades, it delivered exactly as promised.
The relationship held through the dot-com bust, through the 2008 financial crisis, and even through the initial COVID shock in 2020. Bonds did their job.
Then inflation returned. The Federal Reserve responded with its most aggressive rate-hiking cycle in over 40 years. And the correlation that had protected portfolios for decades flipped.
State Street research shows the stock-bond correlation spiked to +0.60 in recent years, compared to -0.37 over the prior decade. A Morningstar analysis covering 150 years of data found that 2022 was the only year in their dataset in which bonds provided no diversification benefit during a market downturn.
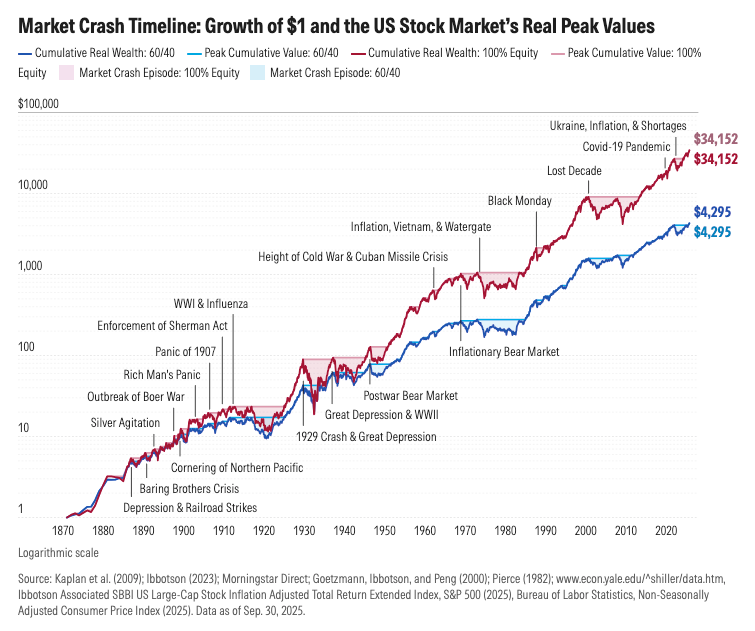
The numbers are brutal. US stocks dropped roughly 19%. The Bloomberg Aggregate Bond Index fell about 13%. Together, a 60/40 portfolio lost 16-17% in a single year — one of the worst calendar-year results in modern history.
The whole premise of the allocation model failed at the worst possible moment.
How Family Offices Invest Now
The UBS Global Family Office Report 2025 surveyed 317 family offices managing an average of $1.1 billion each. Their average family net worth sits at $2.7 billion. These aren't small shops guessing at strategy — they're serious investors with full teams and access to deals most people never see.
Their portfolios look radically different from what traditional advisors recommend.
Global asset allocation for 2024:
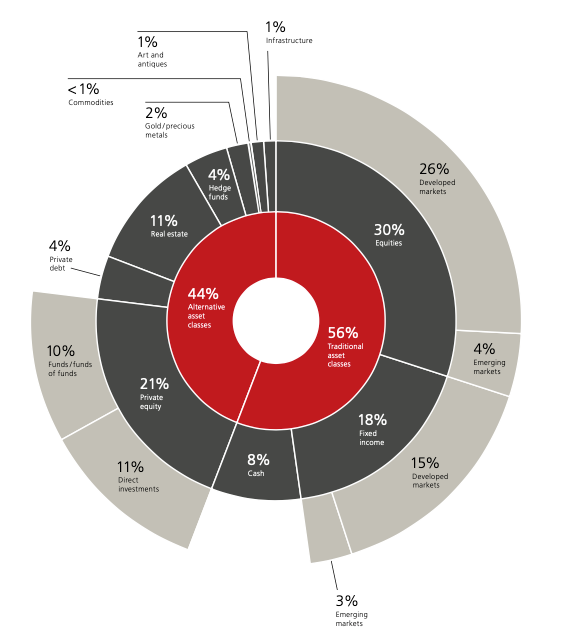
Alternatives make up 44% of the average family office portfolio globally. But those global numbers hide big regional gaps. American family offices lean even harder into alternatives — 54% total, with 27% in private equity alone and 18% in real estate. Bonds? Just 9% of US family office portfolios.
That's not a tweak to the 60/40 model. That's a complete rebuild.
The Allocation Shift: From Traditional to Modern
| Asset Class | Yale 1989 | Global Family Offices 2024 | US Family Offices 2024 |
|---|---|---|---|
| Domestic Equities | ~65% | 26% | 32% |
| Fixed Income | ~25% | 18% | 9% |
| Cash | ~5% | 8% | 5% |
| Real Estate | ~5% | 11% | 18% |
| Private Equity | — | 21% | 27% |
| Hedge Funds | — | 4% | 3% |
| Private Credit | — | 4% | 3% |
| Other Alternatives | — | 8% | 3% |
Sources: Yale Endowment historical data; UBS Family Office Report 2025
Post-Exit Allocation Rethink
This pattern plays out the same way. A founder sells for $20-30 million, parks the after-tax cash in a standard 60/40 split on the wealth manager's advice. Index funds, bonds, the usual package. Then, 2022 arrives, and both sides drop together. The bonds that were supposed to act as a buffer fell nearly as hard as the stocks. The loss triggers a full rethink.
The rebuild tends to look similar across founders who go through it. Public stocks drop from 60% to around 30-35%, with a tilt toward dividend payers. Private equity rises to 15-20% through fund deals and co-investments in sectors the founder knows from building. Real estate enters the picture — direct holdings and private funds. Private credit replaces a chunk of the old bond slot through BDCs or interval funds. Cash stays at 10-15% for new deals.
The shift isn't about chasing returns. It's about matching the portfolio to the founder's real life: a long time horizon, no urgent need for cash beyond a safety buffer, and deep industry knowledge.
What founders who make this move keep saying isn't about the returns. It's that they finally understand what they own. The skills that made them wealthy — pattern spotting, due diligence, sector knowledge — now feed how they put money to work. For someone who spent a decade building a SaaS company, looking at enterprise software deals feels natural in a way that watching index funds drift never will.
Everything here is free. Subscribing just tells me the content is useful — and helps me decide what to write next.
Why Bonds Got Demoted
Bonds served two roles in old-school portfolios: income and safety. Neither works well anymore for investors with serious money.
On the income side, even with yields higher than they've been in years, the maths doesn't add up for wealth building. A 10-year Treasury might yield 4-5% nominal. After taxes and inflation, the real return barely keeps pace with the cost of living.
On the safety side, 2022 showed the limits. When both stocks and bonds fall at the same time, the hedge is gone. And the forces that caused this — sticky inflation, aggressive central bank moves — aren't fading any time soon.
Private debt has largely replaced bonds in serious portfolios. Morgan Stanley research shows direct lending returned 10.5% a year in Q4 2024, beating both high-yield bonds and leveraged loans. During seven periods of rising rates since 2008, direct lending averaged 11.6% — two points above its long-run mean.
KKR's research shows investors can now get 10%+ gross returns on a simple, unlevered basis for senior-secured risk. That's double or triple what bonds offer.
The trade-offs are real — less liquidity, more work, higher fees. But for founders with long time spans who don't need to sell tomorrow, the yield gap is hard to ignore. For a deeper look at how this asset class works and what's currently being stress-tested, see the Private Credit for Founders playbook.
Tax Efficiency Advantage
Beyond raw returns, alternatives often offer tax perks that further widen the gap with bonds. The details vary by country — the examples below are US-focused. Founders in the UK, Europe, or elsewhere face different rules, and the Tax Frameworks for Global Founders article covers that broader picture.
Real Estate Depreciation
Rental property owners can deduct a portion of the building's cost each year — a non-cash expense that reduces taxable income without affecting cash flow. A $1 million rental property might produce $36,000 in yearly write-offs, sheltering that much rental income from tax.
Cost segregation studies can accelerate this further, front-loading depreciation into earlier years when the tax shield provides maximum benefit.
1031 Exchanges
Section 1031 of the Internal Revenue Code lets real estate investors defer capital gains taxes by swapping one property for another of "like kind." Sell a $2 million building with $800,000 in gains, and those gains roll tax-free into the next property — as long as strict rules are followed.
The real power comes from chaining swaps over a lifetime. Each deal defers the prior gains. At death, heirs get a stepped-up basis that can wipe out the stacked tax bill entirely.
Private Credit Tax Treatment
Interest from private credit is taxed as normal income — no better than bonds. But the higher yields more than make up for it. A 10% yield taxed at full rates still beats a 4.5% Treasury yield after tax.
After-Tax Comparison
For a US high-income investor in a 40% combined marginal bracket:
| Investment | Pre-Tax Yield | After-Tax Yield |
|---|---|---|
| 10-Year Treasury | 4.5% | 2.7% |
| Municipal Bond | 3.8% | 3.8% |
| Private Credit Fund | 10.0% | 6.0% |
| Real Estate (w/depreciation)* | 7.0% | 5.5%+ |
Real estate after-tax yield varies significantly based on depreciation, leverage, and holding period.
Tax efficiency often widens the gap between traditional bonds and alternatives far beyond what headline yields suggest.
Yale Model's Lasting Influence
The move toward alternatives started long before 2022. David Swensen began reshaping Yale's endowment in 1985.
When he took over, Yale looked like everyone else: mostly US stocks and bonds. He rebuilt it around private equity, venture capital, hedge funds, and real assets, while cutting bonds to near zero.
Over 36 years, Swensen grew Yale's endowment from $1.3 billion to over $40 billion, earning 13.7% a year — beating the average endowment by 3.4 points.
His core insight: liquidity has a price tag. Most portfolios prize the ability to sell fast. But investors who don't need their money next week can earn higher returns by locking up capital. Swensen called this the "illiquidity premium." By 2019, roughly 60% of Yale's portfolio sat in alternatives. Stocks and bonds fell from three-quarters of the fund in 1989 to less than a tenth.
The UBS report shows that US family offices now look more like Yale than like a retail broker account. The approach works best for investors who don't need quick access to cash, can judge complex deals (or hire people who can), and have enough scale to get into the good funds. For a framework on how to think about building that kind of setup, even without the billion-dollar scale, the Investment Landscape overview is a useful starting point.
Geographic Diversification
Most talk about spreading risk and focus on asset classes while ignoring where those assets sit. For founders who think globally, that's a blind spot.
Country risk is real. Rule changes, tax shifts, currency swings, and outright seizures can wreck a portfolio held in a single location. Anyone who lived through an emerging-market crisis — or who watched Russian assets get frozen in 2022 — knows this in their bones.
Family offices now spread holdings across borders: businesses in founder-friendly places (Delaware, Singapore, Dubai), holding companies in nations with strong tax treaties, real estate across stable markets rather than one city, banking ties in several countries, and passports or residency that give options for where to live and work.
This isn't about dodging taxes. It's about building a setup where no single country can break you.
A founder with $10 million all in US assets faces different risks than one with $4 million in US stocks, $2 million in European property, $2 million in Asian private credit, and $2 million in portable liquid assets. The second founder has more room to move when elections shift, rules change, or tensions rise. The Family Office Location Guide covers how to weigh these choices.
Where This Goes Wrong
Even smart, wealthy investors make mistakes with "alternative-heavy" portfolios.
Concentration Risk
The Archegos collapse in March 2021 shows what happens when bets get too big. Bill Hwang ran his family office into $50 billion worth of positions using just $10 billion in capital — 5:1 leverage packed into a handful of stocks. When ViacomCBS dropped a surprise share sale, the forced selling wiped out Hwang's $20 billion net worth in about 48 hours. Banks lost over $10 billion. Hwang got 18 years in prison.
Diversification within private markets matters as much as diversification across them.
Fee Layering
Private deals cost more than index funds. A typical PE fund charges 2% management fees plus 20% of profits above a hurdle rate. Fund-of-funds add another layer. Some investors end up paying 3-4% a year before any profit share. Those fees stack up fast. A 15% gross return becomes 10% or less after costs.
The question is whether the manager earns the premium. Many don't. The gap between top-quartile and bottom-quartile PE managers is huge — far wider than in public markets. Picking the right manager is the whole game.
Correlated Bets Disguised as Diversification
Owning 50 different things offers no safety if they all move the same way. A portfolio full of leveraged PE, high-LTV property, and private loans to levered companies isn't diverse — it's a single bet on low rates and easy credit. The private credit stress-testing happening right now is proving exactly this.
True diversification means owning assets that behave differently under different scenarios.
Questions Worth Asking
Before changing a portfolio, these questions help tell real skill from product-pushing:
About access to alternatives: What's the total fee — management, carry, fund costs — for each deal? How does liquidity really work, and what happens in a crisis? What's the track record for picking managers here?
About how much risk is piled up: What share of the portfolio reacts to the same forces? How does this mix hold up if rates rise? In a recession? In stagflation? What's the ceiling for any one manager or strategy?
About taxes: Have the after-tax returns been modelled, not just pre-tax? Are the right account types being used for each holding? What's the estate planning impact?
About fit: Does this match the real need for cash over the next decade? How much of this is driven by the investor's needs versus the firm's product shelf? What would change if fees didn't matter?
Advisors who flinch at these questions — or can't give straight answers — are telling founders something about the relationship.
How to Think About Allocation
No single split works for everyone. A 35-year-old founder who just sold faces different needs than a 65-year-old focused on income and legacy. The Decision Architecture for Capital Allocation framework covers how to set up these choices well.
A few questions help frame it. How much needs to stay liquid? Money earmarked for deals, real estate, or personal spending can't sit in 10-year PE lockups. What's the real time horizon? Investing for grandchildren is a different game than funding your own retirement. Where does genuine edge exist? A software founder can read SaaS deals in ways most people can't. That same person may have no edge in biotech or energy.
A common starting point among serious allocators: keep 60-70% in core, liquid holdings that can ride out storms. Use the remaining 30-40% for private-market bets where real illiquidity premiums exist. Adjust the ratio based on how much cash you'll need and when.
What This Means
The 60/40 portfolio served its era. But the things that made it work — bonds that zigged when stocks zagged, decent yields, and limited access to anything else — have all shifted.
None of this means dump your bonds and pile into private equity. Access matters. Knowledge matters. Time horizon matters. Most investors lack the scale, skill, and patience to run these plays well.
But for founders with serious capital and decades ahead of them, the old model means lower expected returns without the safety net that justified it. Family offices aren't working from some secret guide. They're responding to changed facts — putting money where the risk-adjusted maths points.
The founders who built wealth through concentrated bets on businesses they knew cold don't need to pretend they can't judge private deals. The same rigour that made the money can be used to protect and grow it. That's the real lesson from how family offices invest. Not access to exotic products. Thinking like an owner rather than a passenger in someone else's index fund.
Capital Founders OS is an educational platform for founders with $5M–$100M in assets. Frameworks for thinking about wealth — so you can make better decisions.
Explore more: Playbooks · Capital Signals · Wealth Architecture · Investment Strategy · Business Building · Life Design
Found this useful? Forward it to a founder who's thinking about this stuff. Got a question or disagree with something? Get in touch.
New here? Subscribe for one email a week.


