


This is Capital Signal Weekly — timely briefings on what's reshaping Capital Founders' strategy on wealth architecture, investment strategy, business building, and life design.
THIS WEEK IN 30 SECONDS
🔴 Blue Owl halted redemptions and sold $1.4B in loans. Stock down 40% in six months. Contagion hit Apollo, Blackstone, KKR, and Ares.
📉 The SaaSpocalypse landed on private credit. AI disruption repriced software stocks 20% YTD. Problem: ~25% of private credit is SaaS-exposed. Those loans reprice slowly.
📊 Secondaries hit $240B — up 48% YoY. GP-led transactions tripled in five years. Credit secondaries emerged as the pressure valve for locked-up private debt.
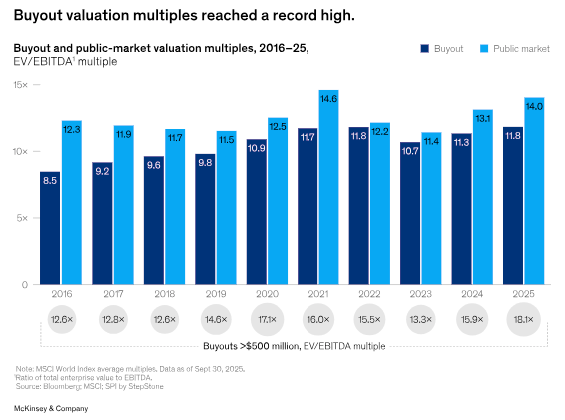
📋 McKinsey's PE report dropped a bomb: 59% of PE returns since 2010 came from leverage and multiple expansion. That era is over. Operational alpha is now the only game.
⚖️ California's wealth tax is advancing — 5% one-time levy on billionaires, retroactive to Jan 1. Other states watching. The precedent matters more than the threshold.
If your wealth manager allocated you to private credit after your exit — and most of them did — this was not a quiet week.
Blue Owl halted redemptions. AI dismantled the business model underlying a quarter of the private credit market. Secondaries broke another record. And McKinsey published data confirming what a lot of us have suspected: the private equity playbook that worked for two decades no longer functions the way it used to.
Four stories. The thread connecting them: the assumptions behind most founders' private capital allocations are being stress-tested simultaneously. Some of those assumptions are failing.
Blue Owl, the SaaSpocalypse, and Why Your Private Credit Allocation Matters
If you hold private credit in your post-exit portfolio — directly, through a fund, or via rollover exposure from a deal — this story is worth understanding. Not because the sky is falling. But because the ground shifted, and most wealth managers haven't updated their maps.
On February 19, Blue Owl Capital permanently restricted quarterly redemptions from its retail-focused private credit fund, OBDC II. Investors had been pulling money faster than the fund's 5% quarterly cap could absorb. At Blue Owl's tech-focused vehicle, OTIC, redemption requests hit 15% of net asset value in a single quarter.
To generate cash, Blue Owl sold $1.4 billion in direct lending assets across three funds at 99.7 cents on the dollar. That sounds reassuring. It isn't — entirely. When managers are under pressure, they sell their best-priced assets first. The loans left behind are the ones nobody was bidding on.
The fallout:
- Blue Owl stock dropped ~10% in a single day and has lost nearly 40% over six months
- JPMorgan CEO Jamie Dimon warned that private credit risks were "hiding in plain sight"
- Shares of Apollo, Blackstone, KKR, and Ares fell 3–10% in sympathy
- Dan Rasmussen of Verdad Capital called it a "canary in the coal mine"

The timing matters because of what's driving the redemptions. This isn't generic market panic. It's specific and structural.
AI is rewriting the economics of software companies.
Enterprise SaaS has been the single largest sector exposure in private credit for years. These were supposed to be the safe loans — sticky recurring revenue, high margins, predictable cash flows. Private credit loved lending against those characteristics. Now, every one of those assumptions is being stress-tested by AI simultaneously.
The exposure data is interesting:
- Software and technology companies account for roughly 25% of the private credit market through year-end 2025 (S&P data cited by PitchBook)
- UBS puts the AI-disruption-exposed share higher, at 25–35%
- Blackstone's non-traded BDC, BCRED, reportedly carried 26% software exposure heading into 2026
- In an aggressive AI disruption scenario, UBS estimates US private credit default rates could climb to 13% — more than three times the projected rate for high-yield bonds
Jefferies' equity trading desk started calling it the "SaaSpocalypse." AI tools demonstrated they could replace entire software workflows. Companies charging per-seat license fees watched their value proposition erode in real time. The iShares Software ETF is down 20% year-to-date. Public markets repriced instantly.
Private credit, by design, reprices slowly.
That lag is the problem. Private credit loans are typically five-to-seven-year instruments, valued by the lenders who made them. When the borrower's underlying business model deteriorates, the marks take months — sometimes quarters — to catch up. Bloomberg noted that some software companies within private credit portfolios are misclassified as retailers or food producers, making true exposure harder to measure than the headline numbers suggest.
To be clear: this isn't a prediction that private credit will collapse. The market is $2.1 trillion and still growing. Fundraising in 2025 hit $224 billion globally. The institutional core is well capitalised. But the retail-facing edge — where liquidity promises meet illiquid assets — is exactly where stress shows up first.
Prime Buchholz published a useful framework on February 24: panic isn't warranted, but complacency isn't rewarded either.
If you sold a company in the past three years and your wealth manager allocated 15–30% of your portfolio to private credit — which is standard practice for post-exit founders — two questions to ask:
- What's the actual software exposure in those funds? Not the headline number. The underlying portfolio. Some managers classify companies in ways that obscure sector concentration.
- What's the redemption structure? If you're in a semi-liquid fund with quarterly tenders, you're in the same vehicle class that just broke at Blue Owl. If you're in a traditional closed-end fund, your liquidity timeline is fixed regardless of what happens.
The era of "allocate to private credit and forget" ended this month. Manager selectivity, structural protections, and active monitoring are now the minimum standards.
Secondaries Are Now the Market, Not a Sideshow
The numbers are conclusive. Jefferies' January 2026 Global Secondary Market Review confirmed that global secondary transaction volume reached $240 billion in 2025 — a 48% increase over the previous record in 2024. More than half occurred in the second half of the year. The market isn't plateauing. It's accelerating.
Key numbers from Jefferies:
- $115 billion in GP-led transactions, up 53% YoY — continuation vehicles represented 89% of that activity
- $125 billion in LP-led transactions, driven by portfolio rebalancing rather than distress
- $327 billion in dedicated secondary capital available — a record, though the capital overhang ratio is actually dropping because deal flow grows faster
- Average LP portfolio pricing held at 87% of NAV, strong historically
- Average buyout pricing declined 200 basis points to 92% of NAV as more mature portfolios came to market
- Jefferies projects H1 2026 should exceed $100 billion, with a clear path toward $300 billion annual volume
McKinsey's 2026 Global Private Markets Report adds the structural context. Five-year rolling distributions as a share of AUM for buyout funds hit their lowest recorded level in 2025. Distributions as a percentage of AUM declined to approximately 6% in H1 2025, compared with a ten-year average of 14%. Over 16,000 companies globally have been held for more than four years — 52% of total buyout-backed inventory, the highest on record. Average holding periods have stretched beyond 6.5 years.
What it means: the companies your LP investments are backing aren't exiting. The cash you expected isn't coming back on schedule. Secondaries exist specifically to solve that problem.
Two developments are worth flagging for founders.
Credit secondaries emerged fast. Jefferies reported that credit GP-led secondary volumes more than tripled in 2025, with GP-led transactions accounting for the majority of credit secondary volume for the first time. This connects directly to the Blue Owl story — as private credit liquidity tightens, the secondary market becomes the pressure valve. Percent launched a dedicated private credit secondary marketplace on February 26, building infrastructure to make these trades easier and more transparent.
Retail capital is also reshaping who buys. Evergreen vehicles raised $113 billion in 2025, with roughly 40% allocated to secondaries. Seven of the ten largest secondary buyers now use evergreen vehicles alongside their closed-end institutional funds. The buyer base is broadening, which generally supports sellers' pricing.
If you're sitting on LP stakes in venture or buyout funds that feel permanently locked — or your post-exit portfolio includes alternatives allocations with no clear liquidity timeline — the secondary market is more liquid, more institutionalised, and more competitively priced than at any point in the past decade. Quality assets trade near par. The discount you might have feared (10–15% a few years ago) has compressed to 6–8% on average, and tighter in competitive situations. That changes the calculus on whether selling makes sense versus waiting for distributions that may not come on schedule.
If you are founder with pre- or post-liquidity founder with $5M-$100M in assets, read our guide how to run family office under $100M:
McKinsey's Message: The PE Playbook That Worked for Two Decades Is Dead
McKinsey's tenth annual Global Private Markets Report landed with cautious optimism on the surface. The structural message underneath was blunter.
Headline numbers look encouraging:
- Global PE deal value rebounded 19% to $2.6 trillion
- Buyout deal value across all sizes hit nearly $1.8 trillion, up 20% YoY
- Exits rose 40%, with IPOs reappearing — Q3 2025 was the biggest quarter for new issuance since 2021
- Megadeals (>$2.5B) returned, including the $55 billion Electronic Arts take-private
Structural numbers tell a different story:
- For deals done between 2010 and 2022, leverage and multiple expansion accounted for 59% of returns. Only 41% came from revenue growth and margin improvement
- Over 16,000 companies globally have been held for more than four years — 52% of total buyout inventory, the highest on record
- Average holding periods have stretched beyond 6.5 years
- Five-year rolling DPI as a share of AUM hit its lowest recorded level in 2025
- Distributions as a % of AUM: 6% in H1 2025 vs 14% ten-year average
- Top quartile buyout IRR: 24% vs S&P 500 TSR of 15% — but median has compressed, and bottom quartile is genuinely poor
- 30% of LPs surveyed consider assets in continuation vehicles "distressed" or "complicated"
The conditions that powered PE returns for two decades — declining interest rates, expanding multiples, abundant leverage — are gone. The only reliable return driver left is genuine operational improvement. What McKinsey calls "alpha that is made, not found."
That ratio is flipping. And it changes what founders should expect on both sides of the table.
If you're allocating to PE funds post-exit, dispersion between top-quartile and bottom-quartile managers has widened dramatically. The best buyout funds still delivered 24% IRR over the past decade — well above public markets. But picking a PE fund in 2026 based on the asset class's historical average return is like choosing a restaurant based on the city's average Yelp rating. Manager selection has never been more consequential.
If you're building a company that PE might acquire, the valuation conversation changes. McKinsey notes the increase in 2025 deal value came "in large part because acquirers were paying more, not because they were doing more transactions." Bigger deals at higher prices, but with stricter expectations on post-close operational performance. Today's PE buyer isn't paying for potential. They're paying for proven unit economics, clean governance, and demonstrated operating leverage.
One data point that should give every founder pause: 30% of LPs consider continuation vehicle assets "distressed" or "complicated." If your equity ended up in a continuation fund rather than a clean exit, that's how the market views it — regardless of what the GP's investor letter says.
Quick Signal: California's Wealth Tax Is Real and Moving
A retroactive wealth tax. Applied to illiquid assets. With almost no time for affected residents to respond.
That's what California's 2026 Billionaire Tax Act actually is.
The key facts:
- 5% one-time tax on the total wealth of California residents worth over $1 billion
- Assessment date: retroactive to January 1, 2026 — the design feature that matters most
- An estimated 200–250 billionaires could be affected
- Potential revenue: approximately $100 billion
- Tax base includes illiquid assets like company stock, but excludes real estate, pensions, and retirement accounts
- Backed by SEIU (healthcare workers' union). Opposed by Governor Newsom
CNBC reported the retroactive date left California's billionaires almost no time to change residency. Peter Thiel has relocated to Miami. Attorneys report that at least two other unnamed billionaires have moved or plan to. Bloomberg reported this week that similar measures are gathering steam in other states.
Tax Foundation analysis shows the bill would force founders to sell significant equity stakes to pay, since the assessment includes illiquid assets like company stock. Jensen Huang's 3.8% stake in NVIDIA, for example, would generate an estimated $8.5 billion in wealth tax liability on holdings worth $170 billion.
For founders in the $5M–$100M range, this probably doesn't apply directly. But the precedent matters. If this structure succeeds in California, it creates a template. And templates scale downward much faster than anyone expects.
Geographic diversification isn't lifestyle preference anymore. It's insurance against political risk moving faster than most founders anticipated.
Until next time!


